API RP 99:2014 pdf free download.Flash Fire Risk Assessment for the Upstream Oil and Gas Industry
a) proximity of the workers to the flash fire hazard;
b) potential for the task creating loss of containment (e.g. line breaking);
c) current operations (drilling, completions, production, construction, gas processing, etc.);
d) engineering controls to reduce the likelihood or consequences of flammable releases;
e) flash fire accident history;
f) means and duration of egress from the potential flash fire exposure zone;
g) multiple fuel sources;
h) chemical exposure;
i) SimOps.
Other conditions might reduce the risk of flash fire. For example, process piping that contains heavy oil may be in good condition and operating well within safe operating pressures. Proper design and maintenance of the system is considered effective engineering control.
5.2 Example Risk Assessment Technique The Bowtie Model is an assessment technique that uses a visual representation to illustrate the risk factors. The exposure to a flash fire (which is the critical event of concern) is placed centrally between the threats on the left (i.e. the factors that can result in a flash fire) and the consequences on the right (the potential adverse results if the flash fire were to occur). Potential consequences would range from “no consequences” to “fatal result.” Prevention measures are the “defense barriers” expected to prevent a threat (on the left side) leading to a flash fire. Mitigation measures (on the right side) are the “defense barriers” that prevent damage and/or reduce its severity.
The effectiveness of each “defense barrier” may be reduced by degrading factors (e.g. lack of training). Following completion of the bowtie model(s), an assessment of the adequacy of the identified “defense barriers” should be completed. Each operation/activity for which a bowtie was created should be assessed. For each operation/activity, the threats and consequences are given a preliminary risk evaluation (low, medium, or high). For each threat/consequence, the defense barriers are listed and the resultant risk levels are determined. Annex B shows an example of a blank bowtie as well as an example of how to complete the bowtie for a flash fire risk assessment.
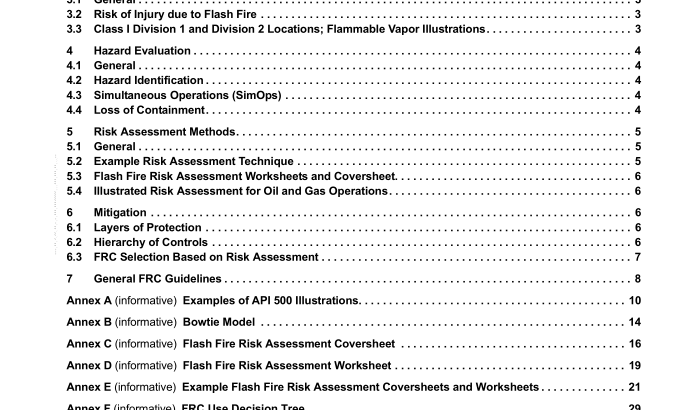
5.3 Flash Fire Risk Assessment Worksheets and Coversheet Annex C provides a 1-page overview/checklist for conducting a risk assessment. This document would be an appropriate format to use as a cover page for a series of assessments. The employer can use Annex D or other techniques to illustrate the adequacy of the “defense barriers.”
5.4 Illustrated Risk Assessment for Oil and Gas Operations As examples, the Flash Fire Risk Assessment Coversheet and Worksheets have been filled out in Annex E to show scenarios that can be encountered. 6 Mitigation
6.1 Layers of Protection Safe operations are the result of layers of protection or safeguards. These layers of protection are put in place to prevent an incident from occurring or mitigate the consequences of an event. Protective layers shall be maintained to ensure effectiveness. Stronger and more numerous independent protection layers will lessen the likelihood that an event will occur or result in harm. Flash fire injuries result from a failure of several protection layers. Flammable vapor must be present at concentrations at or above the LEL, which results from the failure of safeguards designed to ensure containment within equipment and piping, and there must also be an ignition source. Safe work practices, LEL monitoring, electrical area classification, etc. are layers of protection intended to prevent ignition sources while flammable vapor is present. Personnel would need to be present at the location of the fire for an injury to occur. Site control and proximity exclusion prevent exposure. In the event other protective measures fail, garment selection and PPE offers a final layer of protection intended to lessen injury severity.
6.2 Hierarchy of Controls
The selection of controls for mitigating hazards identified during a risk assessment should be based upon the hierarchy of controls. The traditional hierarchy of controls is illustrated in Figure 2. The hierarchy of controls illustrates that methods at the top of the list are potentially more effective and protective than those at the bottom.
Proper utilization of the hierarchy of controls can lead to the implementation of safer systems where the risk of illness or injury has been substantially reduced. Elimination and substitution, while most effective at reducing hazards, also tend to be the most difficult to implement in an existing process.API RP 99 pdf download.API RP 99:2014 pdf free download
